
7 Important Logistics KPIs You Should Start Tracking Immediately

Thanks to the advancement of big data in logistics, you can now track almost every part of your last mile delivery process.
But while big data offers valuable insights, it can also be overwhelming. With so much data available, it’s crucial you identify what to track — and what isn’t as important.
A KPI dashboard can help.
KPIs are key performance indicators — metrics that help you analyze performance at-a-glance. For the last mile, KPIs can help you analyze your service levels and costs quickly to ensure you are meeting your goals. KPIs can also be shared with executives and other departments, creating transparency across your organization.
One mistake people often make when building a KPI dashboard is tracking too many data points. This results in hard to read dashboards that look impressive but aren’t that useful.
Instead, a good KPI dashboard should focus on a handful of KPIs that help you tell the entire delivery story at a glance. You can use a hierarchy style report to dig down into more detail when relevant, but the main KPI dashboard should be easy to understand and focus on the KPIs that highlight whether you are meeting your goals.
Below we’ve listed seven important KPIs for tracking the success of your last mile delivery program. These KPIs will help you assess two main questions:
- Are we hitting the service level we promise customers?
- What does it cost us to run this delivery program?
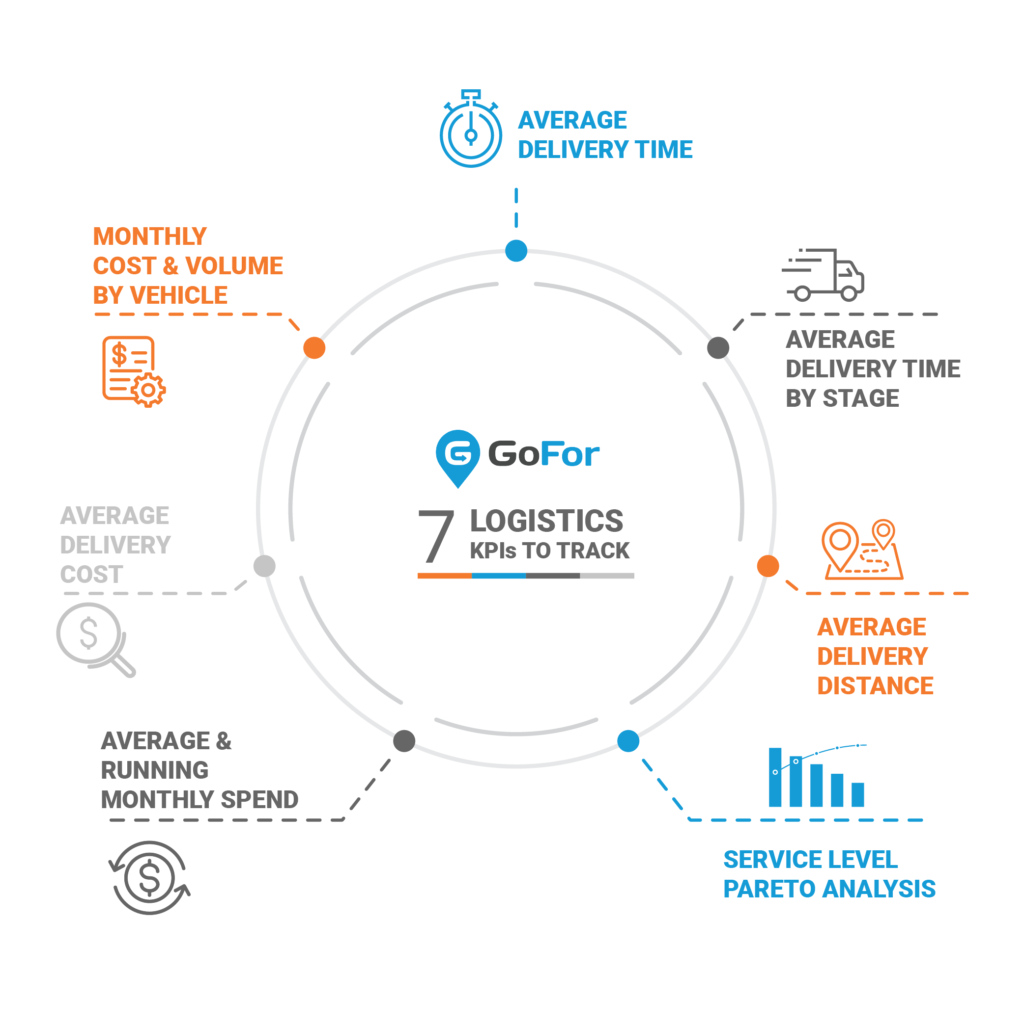
Service Level KPIs: are we meeting our promise to customers?
1. Average Delivery Time
This KPI gives you a great at-a-glance look at your delivery service levels. With this data you can:
- measure month-over-month to ensure service levels are consistent
- drill down into specific stores or regions to identify inefficiencies
- compare your delivery time against vertical averages to see how you are stacking up against competitors
Pro Tip:
Make sure your average delivery time is well below what you market as your service level. Remember, averages require there to be higher and lower data points. If your average delivery time is too close to your marketed service level, you likely aren’t meeting your promise on a significant number of deliveries.
2. Average Time by Delivery Stage
Average time by delivery stage can help you pinpoint delays in your last-mile process. For example, if your drop-off time is longer than expected, you might find your drivers are waiting in a queue at customers’ warehouses. You could then try negotiating for priority lines or rescheduling your deliveries.
Pro Tip:
Keep an eye on the parts of your delivery process that you can control — like packing or pick up. These are areas where you can most easily make adjustments to speed up the delivery process.
3. Average Delivery Distance
If you have multiple stores serving one metro area, this is an important metric to keep an eye on. Customers don’t always choose the most efficient store to order products from. You can re-route orders to keep time and costs down.
Pro Tip:
Typically, the lower this distance, the better. If you start to see your average delivery distance creep up, it’s time to look into why. You can also compare this metric against your average time by delivery stage to see if your average transit time makes sense.
4. Pareto Analysis
A Pareto chart helps you analyze your service level and failure rate. Pareto charts show you the percentage of deliveries completed over time. This helps you identify peaks in ordering and opportunities to rebalance capacity.
Pro Tip:
This KPI should have a dominant place on your dashboard. It will show you whether you are meeting the service level you promise to customers. The more deliveries completed within your promised delivery time, the better.
Costs and Spend Forecasts: what does delivery cost us?
5. Average and Running Monthly Spend
These are great at-a-glance KPIs that help you keep an eye on your costs. You can also use these metrics to identify spending peaks in real-time, drilling down by store or region to find inefficiencies.
Pro Tip:
Keep an eye on peaks in spending. If your running monthly spend is up this month, but the volume hasn’t changed you may have an issue.
6. Average Delivery Cost
Average delivery cost gives you an at-a-glance look at how much your delivery program is costing you, per transaction. It’s a great way to help you identify if you are charging enough for delivery — or to ensure costs are within an approved range for the various services and asset utilization.
7. Monthly Costs + Volume by Vehicle Class
These metrics help you understand what vehicles you are using most often. Volume metrics in particular can also be useful in demand forecasting. Plus you can keep an eye on your fleet utilization and make better decisions about owned vs outsourced assets.
Pro Tip:
If you have your own fleet, watch for vehicle classes with low delivery volumes. It may make sense to outsource these deliveries to an on-demand partner if the utilization is consistently low.
The Bottom Line
Focussing on the right KPIs for your business is a key part of making data-backed decisions. The seven KPIs we’ve discussed in this article are a great starting point, but remember: the last mile isn’t one-size fits all.
Depending on your business and the delivery program you offer, you may need different KPIs to fully analyze your delivery program. Just remember to keep the number of KPIs you track to a minimum, and focus on ones that help you understand if you are hitting your targets.